Tutorials
Click on a button below to learn more.In this section of the website you will find information and guidance on the data and technologies we used throughout the development of the Locate-a-Quake project. Clicking each button will reveal details on that particular technology or page.
Also included will be links to APIs used and data sources accessed in the creation of the website, as well as links to official documentation on the technologies implemented.
GeoJSON
tutorial on GeoJSON

Explanation
GeoJSON is an open standard format designed for representing simple geographical features, along with their non-spatial attributes. It is based on JSON, the JavaScript Object Notation. The features include points (therefore addresses and locations), line strings (therefore streets, highways and boundaries), polygons (countries, provinces, tracts of land), and multi-part collections of these types. GeoJSON features need not represent entities of the physical world only; mobile routing and navigation apps, for example, might describe their service coverage using GeoJSON. The GeoJSON format differs from other GIS standards in that it was written and is maintained not by a formal standards organization, but by an Internet working group of developers. A notable offspring of GeoJSON is TopoJSON, an extension of GeoJSON that encodes geospatial topology and that typically provides smaller file sizes.
Benefit to us
Locate-A-Quake has used GeoJSON within our site to plot the location of earthquakes and represent them using the data within a map provided by Google. This was done using JavaScript (Ajax) calls made to the USGS website seeking data earthquakes. We were able to use the dataset received by USGS to plot locations onto our map by using the co-ordinates gathered from USGS.
Sources
Google Maps
Wikipedia
More detailed information: MarcWright.org
JavaScript Tutorial
tutorial on JavaScript

Explanation
Like server-side scripting languages, such as PHP and ASP, JavaScript code can be inserted anywhere within the HTML of a webpage. However, only the output of server-side code is displayed in the HTML, while JavaScript code remains fully visible in the source of the webpage. It can also be referenced in a separate .JS file, which may also be viewed in a browser.
Advantages and Disadvantages of JavaScript Like all computer languages, JavaScript has certain advantages and disadvantages. Many of the pros and cons are related to JavaScript executing often in a client’s browser, but there are other ways to use JavaScript now that allow it to have the same benefits of server-side languages.
Advantages of JavaScript
- Speed. Client-side JavaScript is very fast because it can be run immediately within the client-side browser. Unless outside resources are required, JavaScript is unhindered by network calls to a backend server. It also has no need to be compiled on the client side which gives it certain speed advantages (granted, adding some risk dependent on that quality of the code developed).
- Simplicity. JavaScript is relatively simple to learn and implement.
- Popularity. JavaScript is used everywhere in the web. The resources to learn JavaScript are numerous. StackOverflow and GitHub have many projects that are using Javascript and the language as a whole has gained a lot of traction in the industry in recent years especially.
- Interoperability. JavaScript plays nicely with other languages and can be used in a huge variety of applications. Unlike PHP or SSI scripts, JavaScript can be inserted into any web page regardless of the file extension. JavaScript can also be used inside scripts written in other languages such as Perl and PHP.
- Server Load. Being client-side reduces the demand on the website server.
- Rich interfaces. Drag and drop components or slider may give a rich interface to your website.
Disadvantages of JavaScript
- Client-Side Security. Because the code executes on the users’ computer, in some cases it can be exploited for malicious purposes. This is one reason some people choose to disable Javascript.
- Browser Support. JavaScript is sometimes interpreted differently by different browsers. Whereas server-side scripts will always produce the same output, client-side scripts can be a little unpredictable. Don’t be overly concerned by this though - as long as you test your script in all the major browsers you should be safe. Also, there are services out there that will allow you to test your code automatically on check in of an update to make sure all browsers support your code.
AJAX
Ajax represents Asynchronous Javascript and XML. XML is a report organizing language. It's fundamental advantage is that it stores information so that the people and computers can without much of a stretch read it. Javascript is a web scripting language used to give some dimension of rationale to a HTML page (HTML itself is just a design language for showing static information). Asynchronous is the essential piece of Ajax. It lets developers make "asynchronous" requests to a server. This ultimately means that the website will not be "waiting" for the request to finish. If it wasn't asynchronous, every time you wanted to refresh something, the site would sort of freeze and nothing would work until the response came back from the server. Asynchronous means things will work while the request is happening and the user doesn't even know about it.
$.ajax({

                            type: "GET",

                            url: "data/winedata.csv",

                            dataType: "text",

                            success: function(response) {

                            mydata = $.csv.toArrays(response);
In the above code we are making use of an Ajax call to bring in our data for the wine chart, the data is received and then converted into an array allowing us to use it within our chart.
Benefit to us
JavaScript has been a key element in developing our site. We have used JavaScript across all pages to perform functions within Bootstrap. Ås well as using it to implement Chart.js, Google Maps and also our own user defined functions. For Locate-A-Quake we have opted to use the JavaScript charting library, chart.js to display our charts. We have chosen to use this library as we believe it is more than capbale of representing our data in a manner which our users could find beneficial. Chart.js gives also gives us additional functionality such as the ability to hover over teh chart elements to see more data and the ability to zoom in and out of the chart using the scroll wheel on the mouse to localize data sets.
Sources
Earthquakes Tutorial
tutorial on Earthquakes

EARTHQUAKES
Weather Tutorial
tutorial on Weather page

Explanation
Apixu.com is owned and managed by Mzemo (http://mzemo.com), a Dubai based mobile and app development company. Apixu.com provides current and 10 day weather data and geo data via. REST API in JSON format. The API will also provide time zone information, astronomy data and geo location data. The weather data is provided in partnership with World Weather Online. We also get our data from different government and metreological agencies.
Benefit to us
To allow us to display weather information on our site we used the APIXU API dataset. APIXU provides current and 10 day weather data in JSON format. We used this data to display information within our Google map. We retrieved the data using Ajax, then it is displayed using jQuery.
When a user clicks a location on the map the are presented with the current weather for that location. Our talented developers also managed to implement a UV Index feature that displays the recommended skin protection as recommmended by CBC and others.
Depending on the UV rating returnign form the API, different guidance is offered the user.
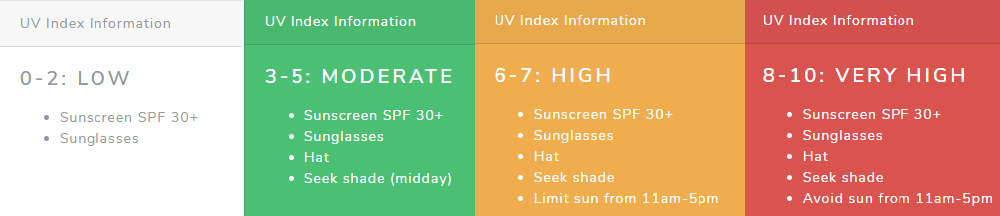
For fun click Scotland on the map to be told that you should be wearing Sunglasses and Sunscreen. Presuming you're Scottish, you'll understand why this is funny, but who are we to argue with the experts 🤷🏻♂️
Sources
Stocks data Tutorial
tutorial on Stocks data

Explanation
About Alpha Vantage Composed of a tight-knit community of researchers, engineers, and business professionals, Alpha Vantage Inc. is a leading provider of free APIs for realtime and historical data on stocks, forex (FX), and digital/crypto currencies. Our success is driven by rigorous research, cutting edge technology, and a disciplined focus on democratizing access to data.
benefit to us
To display our data on the stocks page, we used data provided by Alpha Vantage. This data was brought in via an Ajax call to get a JSON data set which we then used to display the information the chart.
Chart.js was used to model financial data from AlphaVantage. AlphaVantage also provide search functions based on the user input.
Sources
chart.js
Alpha Vantage
Chart.js - OHLC Example
OHLC Chart Description
Oil Rig
tutorial on oil rig page

Explanation
Valhall is a giant oilfield in the southern Norwegian North Sea. Production started in 1982 and following commissioning of the new PH platform in 2013 the field now has the potential to continue producing for several decades. Displaying inlet temperature to a 1stage comparessor showing the temperature at the suction side (38-40) DegC cool and the outlet (cool side 35 DegC).
This chart updates in real time representing the data as and when it is received. The chart can be interacted with allowing you to show only one dataset. Clicking the values at the top hides the selected source from the chart. Hovering your cursor over the line will also give more detailed information about that point.
benefit to us
To display data on the oil rig we sourced data via Ajax again, this time we saved the data locally in a .csv file. We done this to allow us to present the data in a decorative fashion without dispalying any delay to the user.
Google Cloud is the platform for the IIoT (Industrial Internet of Things) data. This can deliver real time sensor changes with 200 to 300 millisecond response times for data access.
Sources
chart.js
AkerBP
Google Cloud with Cognite
Open Industrial Data
Cognite
Cognite Docs
Air Traffic data Tutorial
tutorial on Air Traffic

Benefit to us
To display data on the Air traffic map we sourced data via Ajax again, this time we saved the data locally to allow us to present the data without any delay. Displaying the data within a map provided by Google.
The air traffic page shows data regarding flight information of flights in and out of Glasgow Airport. Within the information is distance of each journey, this distance is calculated using...
The chart can be zoomed in using your mouse and the data within the chart is clickable; e.g. Clicking/highlighting the plottings on the map displays the information of that selected airport. Clicking the flight icon displays information for that selected flight.
Sources
Wine production data Tutorial
tutorial on wine production

Benefit to us
To display data on the wine production chart we sourced data via Ajax again. This data was stored locally to allow us to present the data without any delay. We then used jQuery to display the data within a chart by chart.js.
The wine production chart shows the wine-grower holdings by degree of specialisation based on regions across Europe.
The chart can be zoomed in using your mouse and the data within the chart is clickable; e.g. Clicking the years at the top hides them from the chart / reclicking them unhides them. Highlighting your cursor over the bar displays the hectares for that country/year.
The haversine formula was used to calculate the great-circle distance between two points. More information is cited below